
As you’ve seen, Watzlawick the chicken uses machine learning on lots of different problems, and all these problems have things in common: how the data is structured, what kind of algorithms I use to build the models. We’ve covered validation, measuring error, and we’ve made some plots. Now let’s look at the geometric intuition underneath all these algorithms.
Understanding this concept, called the input space, will let you frame every machine learning algorithm as a technique for solving, more or less, the same problem.
One feature, one target
Let’s start from a simplified dataset with a single feature and a single target. X1 could be the surface of a house in square meters, and Y the price of the house. Or X1 is how long it’s been since it last rained, and Y is the probability of rain. Anything you like. As we’ve already seen, this is an abstract way of representing input and output data.
Let’s go with houses, since you’ll find that example everywhere. A single house is 100 m² and its price is 200,000 euros. This is an observation, or record, or point, as we’ve called it.
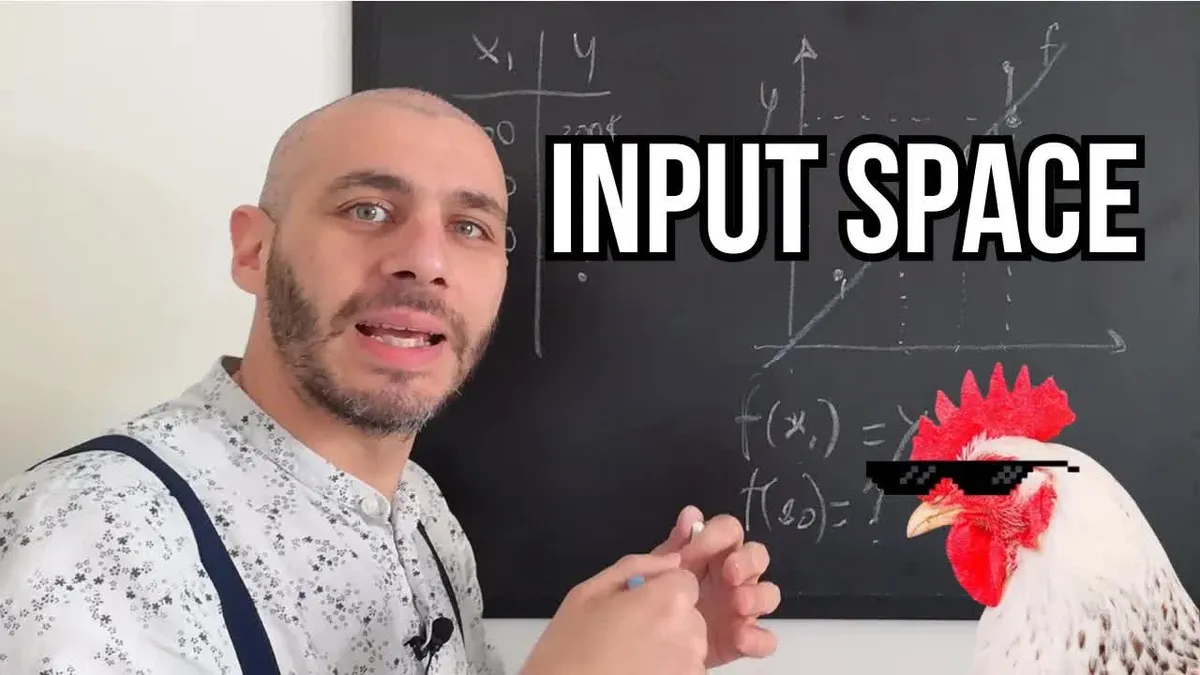
It’s called a point for a reason: this observation can be represented as a point in a geometric space, with the feature X1 on the horizontal axis and the target, the house price, on the vertical one. X is 100 m², Y is 200,000, and that’s where the dot goes (the two axes use different scales for convenience). The house is a point in this geometric space. This is called the input space.
Many dimensions
With one feature and one target it’s a simple dot in two dimensions. But as you know, you might have 10, 20, 100 different features, and each feature gets its own axis. It becomes a space with lots of dimensions - very hard for us to imagine, but easy for a machine to handle.
We reason in two dimensions to understand each other, but imagine another axis for a second feature, coming out of the board. The dot would no longer be in a two-dimensional space; it would have depth, three dimensions. Then four, five, six, N. In any case, every row of my dataset, every record, is a point in this geometric space.
Let’s observe another house: 50 m², 100,000 euros. Another dot. Imagine that over time we observe 10, 20, 30, 40 houses: I build my dataset, it gets more and more rows, and I end up with a cloud of dots in the input space. These are my examples.
The model is a line
As we know, the goal of machine learning is to find a model that maps from the features to the target. In this space you can see it as a line, a curve, or a function of some kind that we call F. F is the model: f(x1) = y. It’s a function that works on the input X and gives me an output Y.
If F is a linear model, it’s a line - or, in more dimensions, a plane or a hyperplane.
This distinction between feature, target, model and point, as we discussed it in Python and as we discuss it here, is essential for understanding every algorithm:
- What we call observations, examples or records are rows in the dataset.
- Every row is a point in the input space, because you can draw it as a point in that space.
- The dimensions of the space are the features, plus the output as an extra axis.
- The model is a line, or a curve - in more dimensions a surface - that for every value of the features gives a prediction of the target. It is defined across the whole space.
Why this is useful
Once I’ve found this model from the data, the line generalizes the cloud of points. It tries to interpolate them, making as few errors as possible: the vertical gaps between the line and the points are all errors, so I have to find the line that makes the fewest.
Once I’ve found that line (in particular its angle, and how high or low it sits), I can handle the next house I observe, whose price I don’t know. Say a house of 80 m² comes in. How much does it cost? The trained model tells us: I compute F(80), go to 80 on the axis, and the model tells me exactly what price the house should have.
So it should be clear that from the points, the examples, I build a function. Then, when I get an input and need a prediction, I simply use that function and completely leave behind the points I used to build it.
This is the input space, and this is the model. It holds for every machine learning algorithm; they’re always discussed in these terms. This is the geometric intuition underneath. And understanding how to adjust this line opens the door not only to linear regression and logistic regression, but also to the neuron inside neural networks, and so on. So this example of the line is really important: it will open your mind, and you’ll be able to understand a lot of things in this world.